Every Day Use of Crystalline Fructose

Posted by & filed under Fructose, Lifestyle Articles.

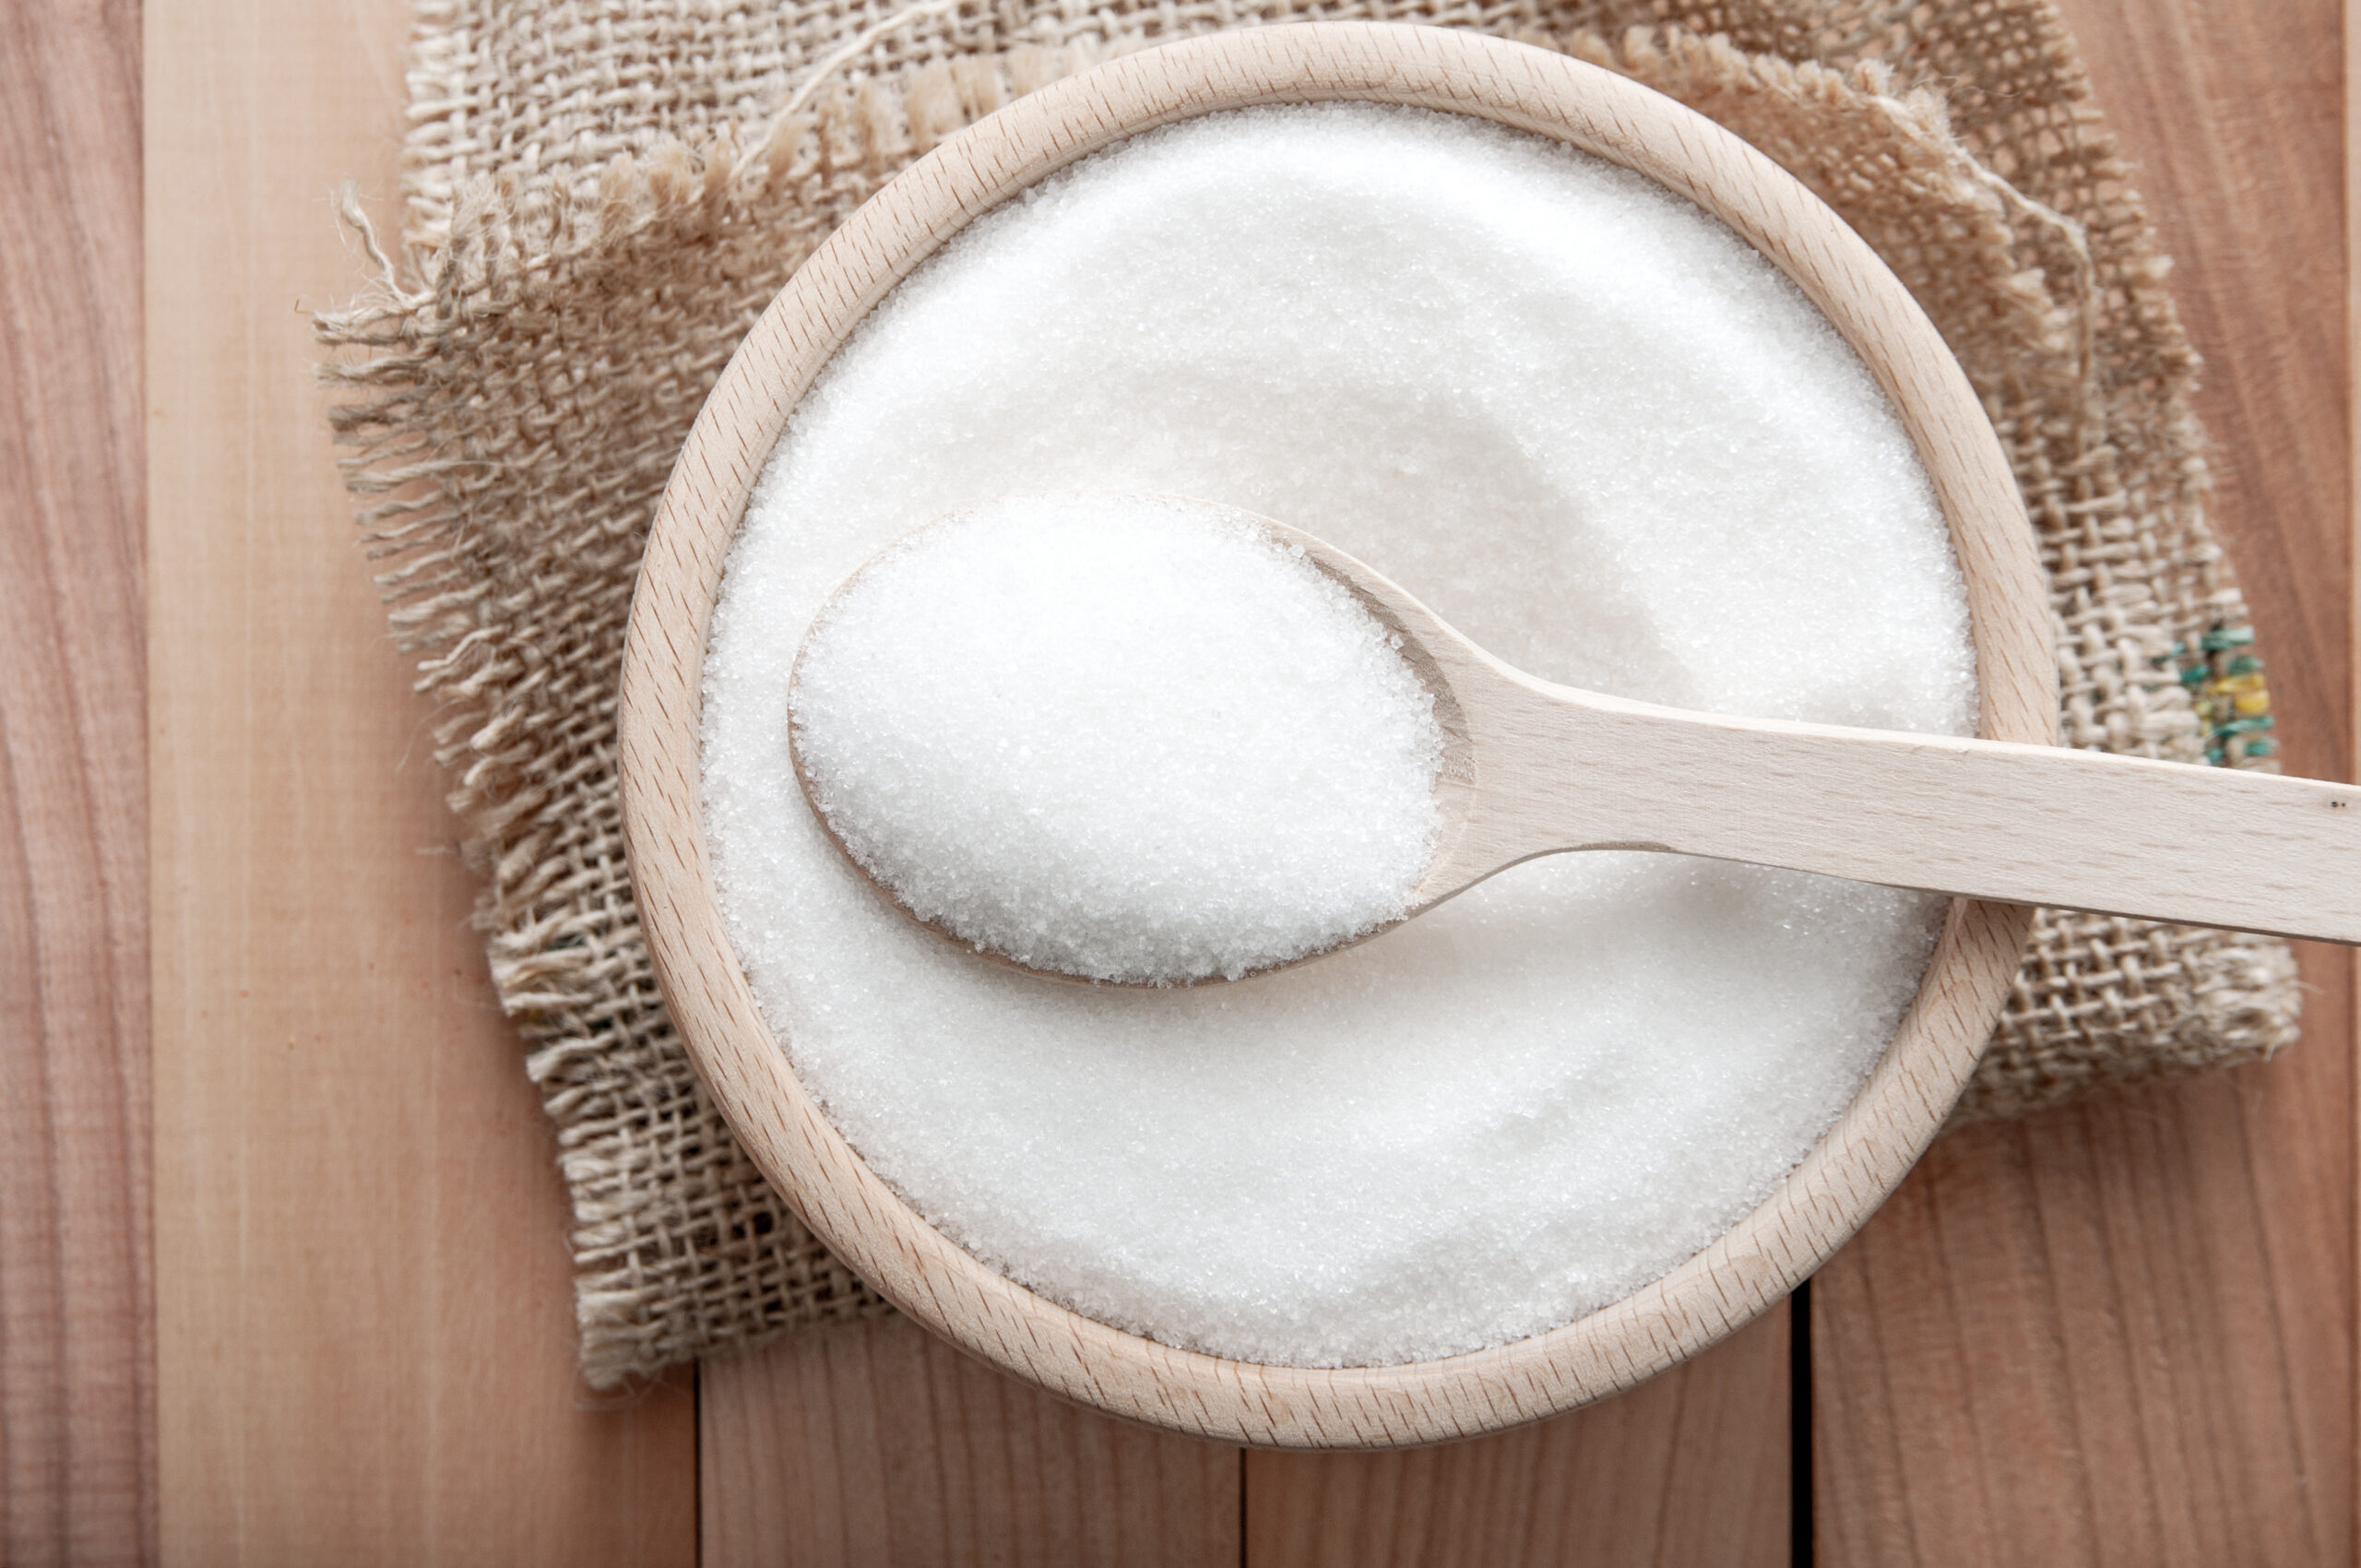
Fructose occurs naturally in various types of foods but it’s commonly referred to as the “fruit sugar” because it’s found in a lot of fruits and vegetables. You can also find fructose in crystalline form, which is derived primarily from cornstarch but looks like table sugar and is 1.2 times sweeter. When used in recipes, crystalline fructose boosts sweetness, texture and food stability. It works as a great substitute in almost everything except cakes.

Unlike corn syrup, crystalline fructose is 100 percent fructose. This means crystalline fructose is sweeter than other products. You can reduce the amount of sugar used in a recipe by a third when you use crystalline fructose and save calories. For instance, if you normally use ½ a cup of sugar in a recipe that is approximately 375 calories, but substitute it with fructose (1/3 cup) then the calorie count for the recipe is reduced to approximately 290 calories.

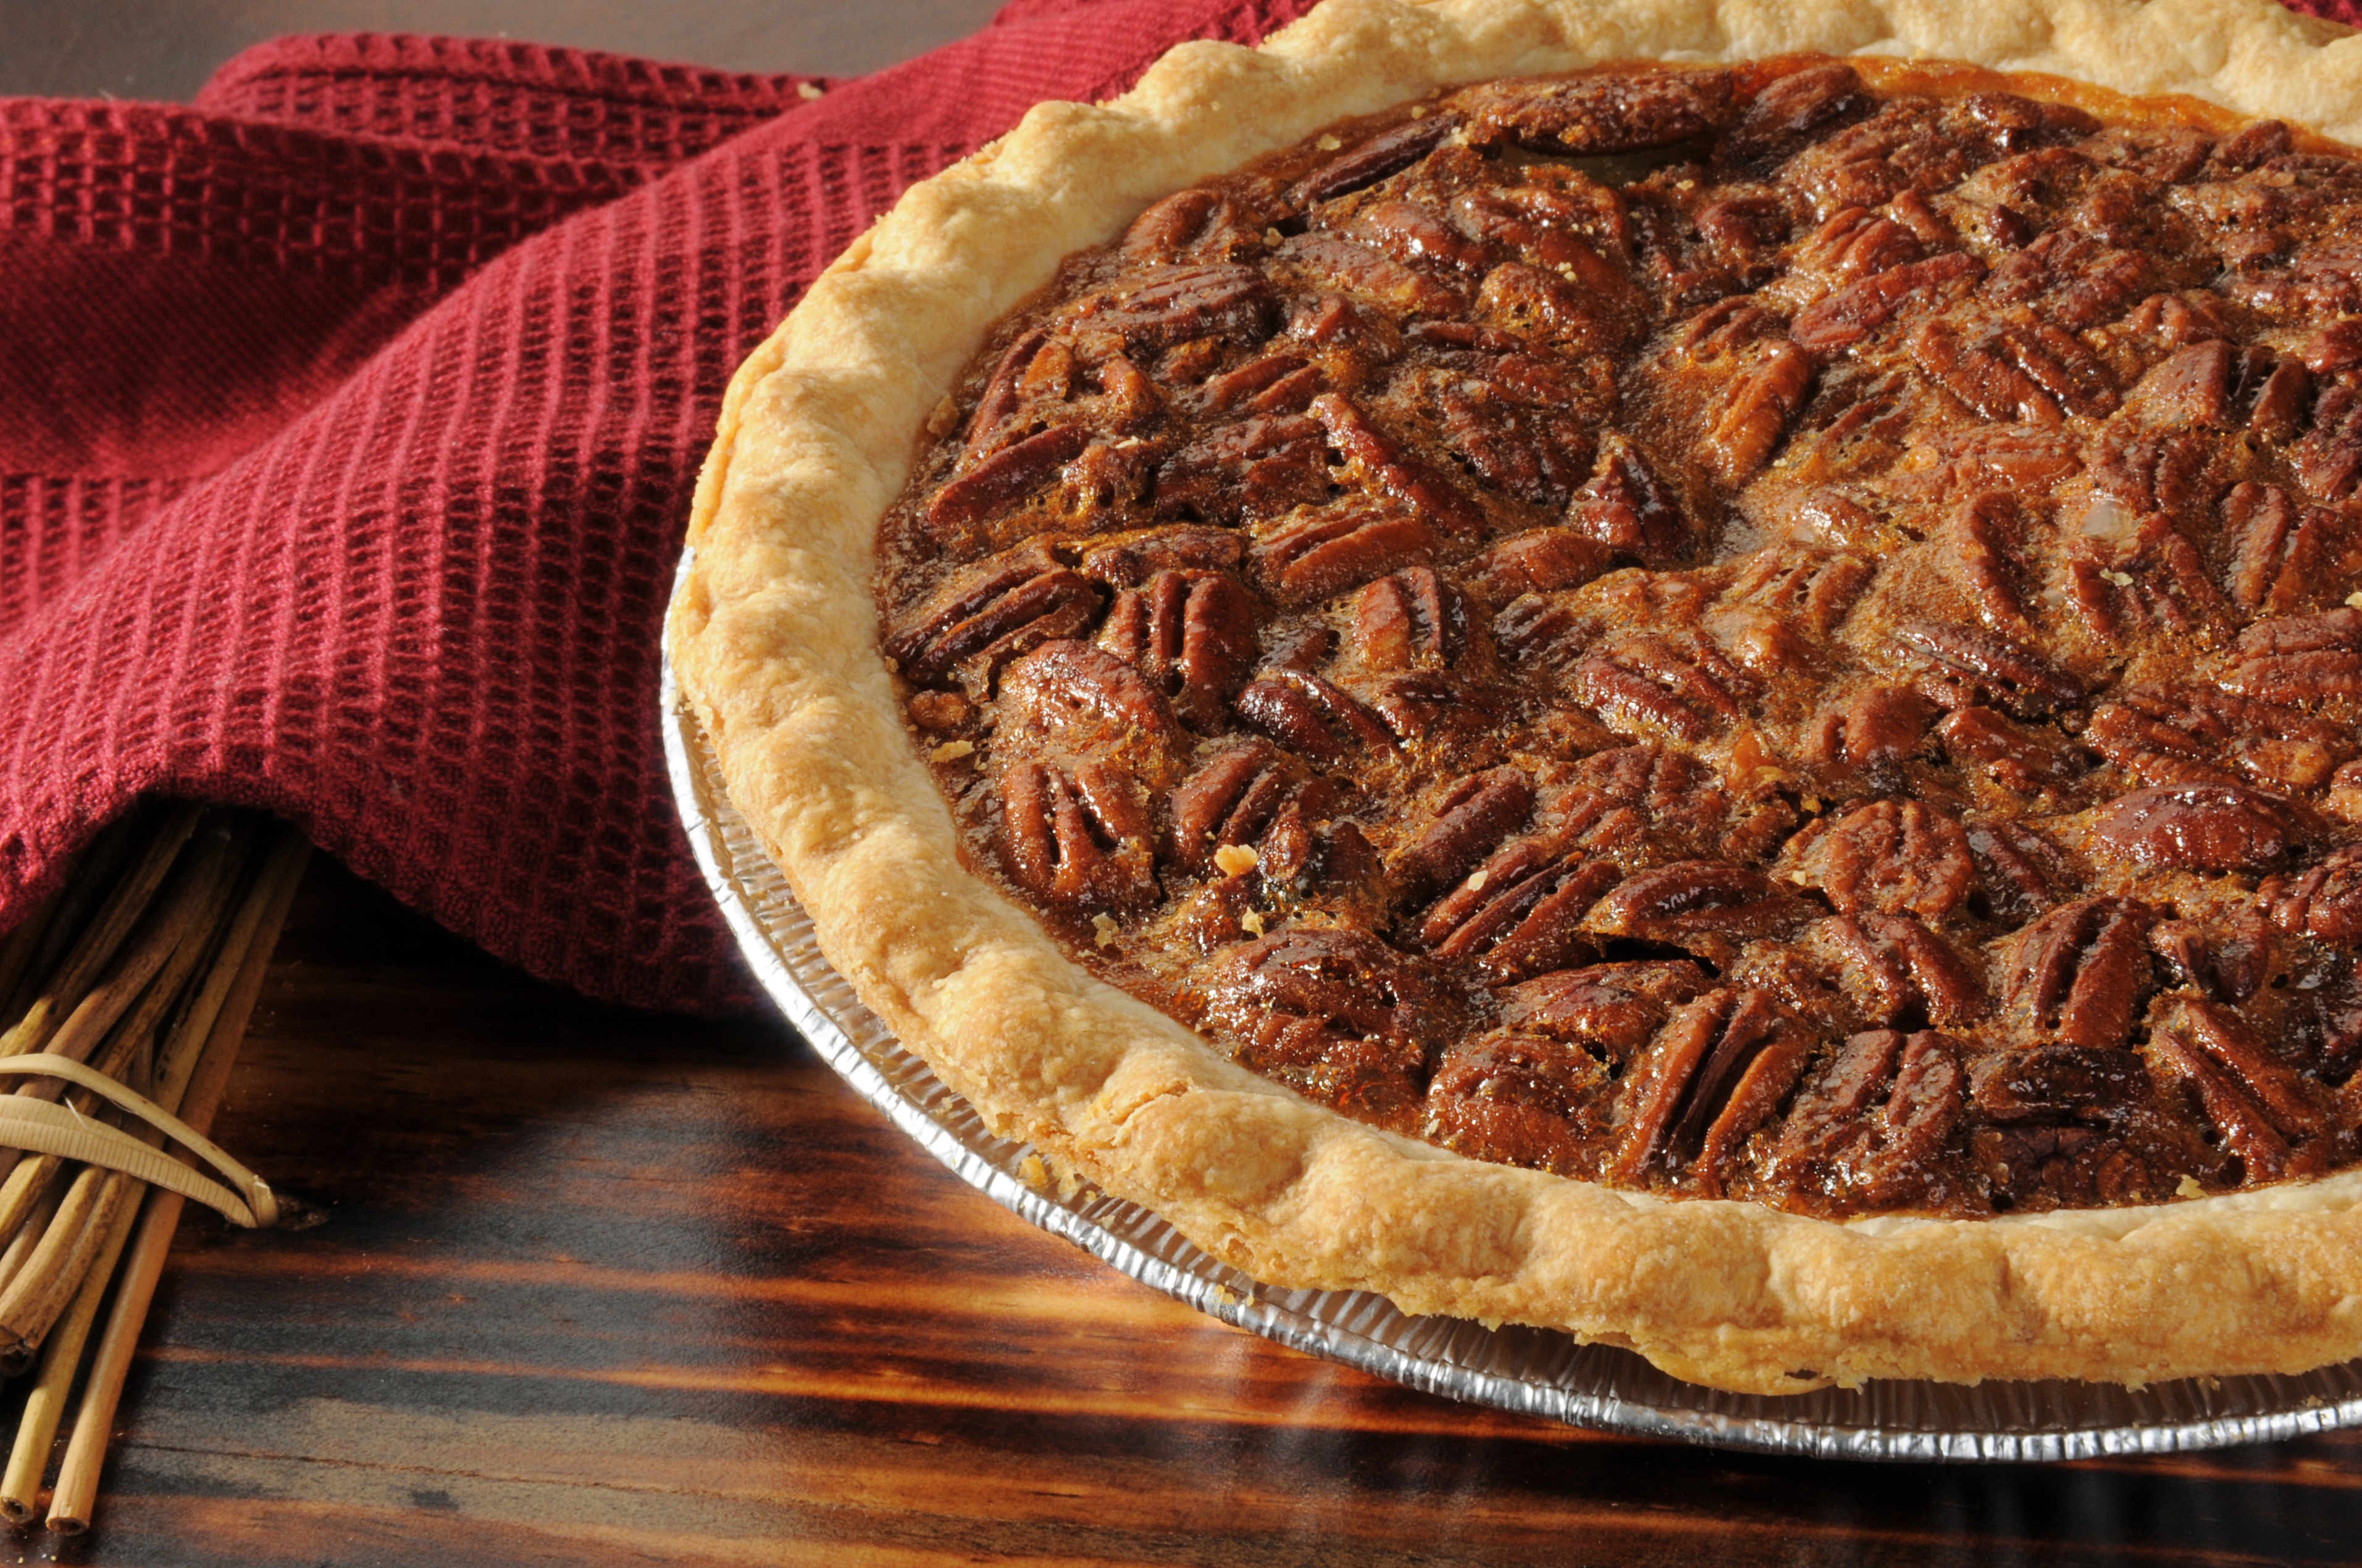
Substituting with crystalline fructose works great with Pecan Pie, for example. The pecan pie recipe provided below is approximately 1,945 calories for the whole pie (243 calories per slice), but substitute the ½ cup of granulated sugar with a ⅓ cup of crystalline fructose, and the calorie count is reduced to 1,860 calories (233 calories per slice). The calorie difference may seem marginal, but these small changes in calories can add up throughout the day.

Pecan Pie by Trisha Yearwood

Ingredients

1 cup light brown sugar, packed
½ cup granulated sugar – substitute with ⅓ cup crystalline fructose to cut calories
2 large eggs
1 cup chopped pecans
½ cup (1 stick butter), melted
2 tablespoons milk
1 tablespoon all-purpose flour
1½ teaspoons vanilla extract
One 9-inch deep-dish pie shell, unbaked, or homemade pastry
1 cup pecan halves

Directions

Preheat the oven to 325 degrees F.

In a large mixing bowl, mix the brown sugar, granulated sugar and eggs until creamy. Add the chopped pecans, melted butter, milk, flour and vanilla extract and stir to combine. Pour the mixture into the pie shell. Arrange the pecan halves on top of the pie in a circular pattern.

Bake the pie for 55 minutes. Check for doneness by shaking the pan slightly. The pie should be firm with only a slight jiggle in the center. It will set more as it cools. Serve topped with vanilla ice cream or frozen yogurt or with a dollop of whipped cream.


Recipe adapted from Georgia Cooking in an Oklahoma Kitchen by Trisha Yearwood (c) Clarkson Potter 2008

The post Every Day Use of Crystalline Fructose appeared first on FructoseFacts.


Peppermint Hot Chocolate

Posted by & filed under Aspartame, Diabetes-Friendly Recipes, Drinks, Recipes.

Makes 4 Servings

Ingredients

1/2 cup Equal Spoonful
1/3 cup water
1/4 cup unsweetened cocoa
4 cups 2% milk
1/4 teaspoon peppermint extract
Lite whipped topping, optional
4 small candy canes, optional

Directions

Combine Equal, water and cocoa in a saucepan. Heat on medium heat, stirring constantly, to boiling. Boil and stir 1 minute.

Stir in the milk. Heat through but do not boil. Remove from heat. Stir in peppermint extract.

Serve immediately in mugs. Garnish each with whipped topping and a candy cane, if desired.

Nutritional Information

Per Serving: 
Calories 149
Protein 9 g
Carbohydrates 17 g
Fat 5 g
Cholesterol 20 mg
Sodium 116 mg

Recipe courtesy of Equal.com.

The post Peppermint Hot Chocolate appeared first on Aspartame.


Fructose is Not the Enemy

Posted by & filed under Fructose, Lifestyle Articles.

Do you cringe when you hear the word fructose? Fructose has received a bad reputation recently due to media and its association with the term “high fructose corn syrup”. Fructose is blamed for obesity, diabetes and other health concerns, but does fructose really cause these problems?

While it is easy to blame one food ingredient over another for health problems, it truly comes down to balance on our plates and our cups. So let’s break down the facts on this misunderstood sugar and double check our perception of sugar.

Fructose is a naturally occurring sugar found in fruits, some vegetables, honey, sugar cane and sugar beets. Fructose is found in table sugar and high fructose corn syrup (HFCS) but you can also find dried crystalline fructose. People often use the terms HFCS and fructose interchangeably, but they are not the same. HCFS is more like sucrose, or table sugar, in that it contains equal amounts of glucose and fructose. Fructose is also naturally found with glucose and other sugars in fruits, honey, and some vegetables. Crystalized fructose contains only fructose and can be found in the baking aisle of many grocery stores.

Regardless of whether you consume fructose in fruits, honey, table sugar, or in a crystallized form, the number of calories is the same. Fructose has the same calories per gram, four calories per gram, as any other sugars, which means it doesn’t matter the type of sugar you consume, your body is gaining the same amount of energy. What is important to understand is that fructose is sweeter than other sugars so you may be able to use less of it to achieve the same amount of sweet taste.

Fructose has been dubbed by some as “unsafe” but this is not the case. The Food and Drug Administration has listed fructose as “generally recognized as safe” since research has shown that consuming fructose does not cause adverse effects, particularly when the same amount of calories are consumed.

While fructose is considered safe and has some benefits, moderation is key. The American Heart Association recommends 100 calories or less from sugar each day for women, and 150 calories or less from sugar each day for men.  And the current Dietary Guidelines for Americans, released in 2015, recommend no more than 10 percent of daily total calories should come from sugar.


The post Fructose is Not the Enemy appeared first on FructoseFacts.


Sugar Sweetened Beverages but Not Diet Soda Consumption is Positively Associated with Insulin Resistance

Posted by & filed under Fructose, Health Professionals, Research Summaries.

A longitudinal study examining the association between intake of sugar-sweetened beverages (SSB) and diet sodas on insulin resistance and incidence of prediabetes was published in November issue of The Journal of Nutrition. Researchers used a subsample of participants from the Framingham Heart Study’s Offspring cohort (n=1685). Data from 126-item food frequency questionnaires (FFQ) collected from the fifth (1991-1995) to the eighth (2005-2008) examinations was used for the analysis. Intake of sugar-sweetened beverages was estimated by including  the FFQ 4 SSB items including “1) caffeinated colas with sugar, 2) caffeine-free colas with sugar, 3) other carbonated beverages with sugar, and 4) fruit punch, lemonade, or other noncarbonated fruit drinks.” Diet soda intake was estimated through the use of 3 FFQ items to include “1) low-calorie colas; 2) low calorie, caffeine-free colas; and 3) other low-calorie carbonated beverages.”  Researchers considered an intake of 360mL to be equivalent to one serving. To assess overall diet quality, researchers utilized the 2010 Dietary Guidelines Adherence Index (DGAI). Primary outcomes of interest were fasting plasma glucose, insulin resistance as determined by homeostasis model of insulin resistance (HOMA-IR), and the development of both prediabetes and type 2 diabetes (T2D).

For the primary statistical analysis, researchers adjusted for baseline fasting plasma glucose, age, sex, current smoking status, physical activity level, hypertension, BMI, DGAI, and intakes of energy, alcohol, and fruit juice. For the secondary analysis, researchers replaced DGAI with individual foods (coffee, whole grains, vegetables, red meat, fish, and nuts) to “explore the potential effects of specific food groups on the associations of beverages with the outcomes.”

Researchers found that at baseline, SSB consumers were more likely to be young, male, current smokers, engaging in more physical activity, consuming more energy from fruit juice and with an overall less healthy diet. Compared to SSB consumers, diet soda consumers were slightly younger, less likely to smoke, had higher BMI, greater waist circumference, a higher fasting glucose, and greater insulin resistance. There was no noted sex differences for the diet soda group.

Of the 1695 participants, 823 developed prediabetes. After adjustment for the previously mentioned potential confounders, it was discovered that those in the highest quartile for SSB consumption (consuming 6 servings of SSB per week or more) had a ~46% higher risk of incident prediabetes than those in the lowest quartile. Interestingly, adjusting for BMI change over the course of the study did not significantly alter the results. Conversely, after adjusting for BMI, BMI change over the course of the study, and all other potential confounders, there was no significant association between diet soda intake and incident prediabetes. As for HOMA-IR, a method used to quantify insulin resistance and beta-cell function, a higher SSB intake was associated with a higher HOMA-IR after adjusting for confounders.  In contrast, diet soda intake was not associated with changes in HOMA-IR after adjusting for confounders.

Researchers conclude “that the long-term consumption of SSBs predicts increased insulin resistance and a higher risk of developing prediabetes, independent of body weight. In contrast, long-term diet soda intake was not associated with elevated insulin resistance or prediabetes risk.”

The post Sugar Sweetened Beverages but Not Diet Soda Consumption is Positively Associated with Insulin Resistance appeared first on FructoseFacts.


Total, Free, and Added Sugar Consumption and Adherence to Guidelines

Posted by & filed under Fructose, Health Professionals, Research Summaries.

An article published in Nutrients sought to estimate intakes of total sugars, added sugars, and free sugars and their main food sources in Dutch children and adults using data from The Dutch National Food Consumption Survey (DNFCS). The DNFCS is “representative for the Dutch population with regard to age and sex within each age group, region, degree of urbanization and education level” and included those aged 7-69 years. The present study had a sample of 3,817 participants. Dietary intake was measured by two non-consecutive 24-h recalls. Dietary quality was assessed using the Dutch Healthy Diet index and food composition was determined using the 2011 Dutch food composition table.

For this study “Added sugars were defined as all sugars that are added during food manufacturing and preparation…Added sugars did not include naturally occurring sugars found in unprocessed products (fruit, vegetables, legumes, potatoes, fish, meat, poultry, and eggs), juices, fruit concentrates, bread and lactose in dairy. Free sugars were defined according to the definition of the WHO as ‘all sugars that are added during food manufacturing and preparation as well as sugars that are naturally present in honey, syrups, fruit juices, and fruit concentrates.’”

Researchers report that the median total sugar intake was 115g/day which contributed 21.5% of the total caloric intake. The median added sugar intake was 64g/day which contributed 12% of the total caloric intake and the median free sugar intake was 74g/day which contributed 14% of the total caloric intake. Researchers note that children (7-18 years old) had a higher overall sugar intake than adults (19-69 years old).

The food groups which contributed the most to intake of total, free, and added sugars across both age groups were “non-alcoholic beverages”, “sweets and candy”, “dairy”, and “cake and cookies.” “Non-alcoholic beverages” contributed most to total and free sugars whereas “sweets and candy” contributed most to added sugars. Of the “non-alcoholic beverages”, “soft drinks” made the largest contribution to sugar intake.

Of the 3,817 participants, one boy, one girl, and 4% of adults were in alignment with the British Scientific Advisory Committee on Nutrition (SACN) and the conditional World Health Organization (WHO) guidelines to not exceed 5% of daily total calories from sugar. When the guideline was relaxed to not exceed 10% of daily total calories from sugar, 5% of boys and girls, 33% of men, and 29% of women were in adherence. Interestingly, the overall diet quality was comparable between adherent and non-adherent men and women; however, the adherent participants were more likely to have higher fiber and vegetable intake and less saturated fat and alcohol consumption.

Researchers conclude that “within the Netherlands, fruit juices and sugar sweetened beverages, including soft drinks, lemonades, and energy-drinks, contributed most to the intake of free sugar, especially in children.”

The post Total, Free, and Added Sugar Consumption and Adherence to Guidelines appeared first on FructoseFacts.


Early Life Sugar Consumption Affects the Rat Microbiome Independently of Obesity

Posted by & filed under Fructose, Health Professionals, Microbiome, Research Summaries.

A recent study published in The Journal of Nutrition utilized a rodent model to assess the impact of early-life added sugar consumption on the composition of the gut microbiome, caloric intake, and weight gain. Researchers divided 42 juvenile male Sprague-Dawley rats (post-natal day 26) into 4 groups that were maintained on identical diets with varying sugar water solutions (11% wt:volume) until post-natal day 92. Their dietary intakes are described in the table below. Fecal samples were collected and sequenced on post-natal day 80 to measure changes in the microbiome.

% Fructose% GlucoseDiet
Group One

(n=11)

3565Lab Diet 5001

29.8% kcals from protein

13.4% kcals from fat

56.7% kcals from carbohydrate

Group Two

(n=11)

6535
Group Three

(n=10)

5050
Group Four [Control]

(n=10)

00

Researchers found that there was no significant difference between groups for body weight gain, overall caloric intake, body fat, lean mass, or overall adiposity index. Rats that consumed sugar water consumed less of the solid food. As a result of this well-established compensatory behavior in Sprague-Dawley rats, all three sugar groups consumed a significantly lower percentage of energy from fat and protein compared to the control.

The 16s rRNA sequencing of fecal samples taken at post-natal day 80 revealed a distinct clustering pattern when comparing the sugar to non-sugar fed rats. Interestingly, when comparing the 3 different fructose-to-glucose ratio groups, there was no distinct clustering pattern observed. Researchers detail a number of shifts in the microbiome at the phylum, class, order, family, and genus level. For example, at the phylum level, Proteobacteria and Actinobacteria were elevated in the sugar consuming groups. At the class level, Actinobacteria, Bacilli, Alpha-, Beta- and Gamma-Proteobacteria were significantly elevated in the sugar consuming group.

Researchers conclude “that the gut microbiome is affected by added-sugar consumption during the juvenile and adolescent stage of development and that these differences are independent of obesity status and caloric intake. Moreover, the monosaccharide ratio of fructose to glucose did not significantly contribute to the overall effects of sugar consumption on microbial populations.”

The post Early Life Sugar Consumption Affects the Rat Microbiome Independently of Obesity appeared first on FructoseFacts.


faq2Do you have questions about low-calorie sweeteners? Want to learn more about maintaining a healthy lifestyle? You asked and we listened. Our resident Registered Dietitians answered the most popular questions about low-calorie sweeteners.

Media Contacts

For media inquiries please reach out to any of the below contacts: